Virtual Reality – Real Insight August 8, 2017
Posted by Jon Ward in Advertising, eye tracking, Market Research, Shopper Research, Technology, Updates.add a comment
Imagine the excitement, akin to a Christmas morning as the UPS delivery driver gets you to sign for the box that contains a thing of beauty, your shiny new VR headset. But this is no ordinary VR headset, oh no – not for you – master of all your survey, keeper of the technology, King or Queen of the early adopters! This is a VR headset with a built in eye tracker, and you are ready….. ready to dive into far off lands, explore supermarkets on the other side of the world and measure your virtual driving skills around the race track and then take over the world and….. hang on… wait a minute…. what are these instructions saying? “download the SDK and API and integrate it into your own platform….” but….. but….I don’t have time for this I have worlds to dominate! We hear you and we have the solution to your problem.

The current crop of eye tracking integrations into VR supply you with an API and SDK, and maybe some example code to stream and save data into Unity, WorldViz or similar… but not much else, and while some of the coders out there get excited about this blank canvas our experience is that most people want something they can work with pretty much right away. But it isn’t quite that easy.
Unlike screen based or glasses based eye tracking software where you have a lot of known parameters (the website is on screen and it is http://www.acuity-ets.com, or I know the user was shopping in Tesco in Croydon and this is what the shelf looked like), with VR you could be flying a spaceship down a canyon on Mars, or walking through a prototype Apple store in Singapore via a brief trip to a coffee shop to take part in a social science project. The boundless flexibility of virtual reality presents a challenge, it is almost impossible to create a platform that covers everything anyone might want to do in VR. ALMOST impossible.

At Acuity we have over 10 years’ experience in using eye tracking at the coal face, whether that is selling systems, running research, troubleshooting and advising on R&D or helping people go beyond the heatmap and get real value from the data and we know that people aren’t going to be happy with just an SDK for their new VR headset – they want more. So we made AcuityVR.
AcuityVR is a module designed to work with new or existing Unity assets, meaning that your existing investment in models can be reused, or you can build new ones and we have some amazing content partners we can recommend, if you don’t have in-house capabilities. We don’t ask you to change the way you do things, so if you use controllers for interaction then that’s fine; if you have enough space for people to walk your VR environment – not a problem for AcuityVR. The way we have designed it means that you can drop the code into a driving simulator, a walkthrough of a train station, a virtual pet grooming salon, a retail store, a clinical simulation or…. well just about anything!

We wanted to make the product a logical step from current eye tracking platforms on the market so you will see all the usual functionality in place – you can live view sessions and see the eye gaze as your participant moves around the environment; we have gaze replays, heat maps, opacity maps and statistical analysis of areas of interest – and all of these for single or multiple users. But VR gives us so much more opportunity – how about replaying multiple users at the same time while you view the environment from different angles and when you notice interesting behaviour simply switch to that persons point of view? Add multiple camera views to give different vantage points throughout the journey and view behaviour from 1st or 3rd person perspectives. We also measure and track footfall, dwell time and direction of journey – ideal for wayfinding and layout planning. Of course, being Acuity we know that eye-tracking data requires some specialised algorithms to turn data-points into fixations, and so we took care of that too, so you don’t need a PhD in eye-movements to make sense of the data.

One of the key benefits of research in VR is that you control the entire environment and this provides a number of benefits that simply can’t be matched in real world testing. Firstly every single item in an environment can be automatically classed as an AOI. That’s right, no more drawing little boxes or creating key frames. Every item in the environment can automatically have statistical data captured. In real time. If a person engaged with something you didn’t expect, no problem AcuityVR already has the stats. Measure fixations, glances, average fixations durations and time to first fixation instantly. Want to re-use the dataset for POS instead of product interaction, sure – the data is already there and rea dy to go! All of our visualisations, replays, stats and other tools are available instantly after the session is finished – no more waiting for days for coding, number crunching or exporting image and videos. This leads to both time and cost efficiencies in research, design cycles and implementing change.

VR allows you to control the world (well, at least the virtual world – actual global domination comes later!) – imagine the possibilities of being able to dynamically change environments. Turn a daytime driving simulation into night instantly, then add some fog or a thunder storm. Take products out of stock off the shelf or change pricing in real time. Have an avatar respond negatively to the user by not making eye contact with them. Use 3D audio to totally immerse the user…. the possibilities are endless within VR, and eye tracking adds a whole new dimension for optimisation, interaction and research capabilities in virtual environments. But without a tool to capture and anlyse the data, all that potential can prove difficult to achieve. AcuityVR is that tool.
Give us a call, drop us an email or maybe send us a virtual hello at sales@acuity-ets.com or visit http://www.AcuityVR.com for more.
There is an Eye in Motion (Capture) July 24, 2017
Posted by Jon Ward in Biometric, eye tracking, Glasses, Technology, Tobii.add a comment
We are very excited to announce that Tobii and Qualisys have released a direct integration between the market leading Tobii Glasses 2 eye tracking system and the Qualisys QTM software platform. This exciting partnership means that eye tracking data can be plotted like any other data type in QTM and as well as visualisations gaze vector data can be exported to MATLAB or similar, or captured in an external source via the real-time streaming protocol. In addition the hardware sync the integration starts both the glasses and cameras simultaneously for incredibly accurate synchronisation of the data streams and I am sure you will agree that for gait analysis, sports science, gaming, behavioural analysis, psychology and more this news is incredibly exciting.

As you can see from the above image as well as the standard vector models if you use the Opus camera system you get the ability to overlay the 3D overlay over live video to really bring your research to life!
To download the PDF click here : Tobii and Qualisys Integration and don’t hesitate to get in with any questions you might have or to find out more.
HTC Vive Eye Tracking Integration – See Virtual, In Reality July 5, 2017
Posted by Jon Ward in Uncategorized.add a comment
Our most popular product at the moment is by far the new Tobii HTC Vive eye tracking integration and we are happy to announce we have several demo units available, packaged up and ready to hit the road to demonstrate to our customers.
The initial feedback both internally and externally has been amazingly positive and with the headset, combined with the Razer Blade laptop, all neatly packaged in a customised Peli case – we want to visit you and showcase the capabilities and possibilities for this amazing technology.

Drop us an email on sales@acuity-ets.com or call us on 01189 000795 to get a date in the diary.
The Great Eye Tracker Amnesty! June 30, 2017
Posted by Jon Ward in eye tracking.add a comment
Over the nearly 10 years Acuity ETS have been around there have been a number of eye tracking companies that have appeared in the ever-expanding market space and that is great for consumer choice and competition, however unfortunately not all of them survive and others are purchased or merge into other companies to be integrated into hopefully bigger and better things. Some of course cease trading or change focus – and that isn’t great for the users of their equipment.
Eye tracking equipment comes in at many prices points, users of the $100 Eye Tribe system were angered when the company was bought and they instantly closed down all support for their products, well what if that had been a £20,000 professional eye tracking system that you had to struggle to get budget for and is now obsolete, unsupported or even worse – broken.
Tobii have always offered an upgrade path for their users, so that your existing hardware can be traded in and a generous discount given off the new equipment, it has proven hugely popular with some of our customers on their 3rd or 4th system, always keeping ahead of the curve with the latest technology. But this has always been a ‘same brand’ option – Tobii for Tobii. But that’s not how it works in other walks of life right? You can part-ex your car against a different brand for example, the same with a mobile phone – so why not an eye tracker?
Well now you can, we are offering customer the opportunity to trade in their screen based or wearable eye trackers and software to receive a discount off a new Tobii system, and we are opening it up to all recognised manufacturers, so if you have an Eye Tribe or an ASL, an Eyelink or a SMI then give us a call. Even if you want to cross platforms and go to wearable from a screen based system, we can help you out – and academic discounts apply on top of the trade in.
Get in touch – we would love to hear from you!
The Apple of Your Eye? June 28, 2017
Posted by Jon Ward in eye tracking, Tobii.add a comment
The newswires are buzzing along with the fact the SMI (our biggest competitor in the market place you might suggest) have been purchased by Apple for reasons currently unknown, at least publically. So what does this mean for the industry, for Tobii, and of course customers and users of their technology.

Firstly, from a technology perspective this is a hugely positive thing. While Apple typically lock down their infrastructure and architecture to their app store, hardware and OS the fact they have made a move to buy one of the larger players in the field reinforces the fact the eye tracking is a technology on the rise, one that will only increase its presence in our daily life. If we look at Facebook’s acquisition of Eye Tribe (via Oculus) and Google purchasing Eyefluence all of the big tech players are buying into eye tracking. In a big way. Whether it is for research purposes, interaction or to optimise hardware performance there is obvious value and ROI by including eye tracking and everyone is getting on board.
![]()
From Tobii’s perspective it can be seen two ways. The obvious one is “Hooray!” one of the biggest competitors we see on a daily basis are no longer around, so of course we would hope to serve more customers and we are confident that we have the technology, products and capability to ensure their needs are met. From the other angle, not having someone just around the corner, pushing you, innovating, driving you to develop can be a bad thing. Google had Yahoo (at one stage!) amongst other suitors to the throne, Apple had Microsoft (or vice versa) and Commodore had Sinclair (retro throwback for some!) – these rivalries help push things forward, to be the best and without that driver you need to push yourself. Am I confident that Tobii will do this? Yes. Why? Because we feedback our thoughts and ideas regularly into design and planning meetings, we collate requests from our customers and pass that on and the team in Sweden and beyond are committed to eye tracking across all markets – from gaming interaction to research, from VR to accessibility.

A little more of a grey area is where does this leave SMI’s customer base? Will Apple continue to sell research products? I doubt it. Their other acquisitions have all been absorbed into the behemoth from Cupertino. What about support? Software updates? Repairs? How about people who have just purchased or are about to purchase a system? I am sure with time there will be more information released and maybe some long-term planning to cover all these aspects. At Acuity we would be happy to help out where we can, of course we would be keen to sell people a new system or assist with a quote (in fact we are also pleased to offer a trade in for existing SMI users to upgrade their systems to one of the Tobii platforms, with access to support, updates and future innovations), but we will happily help with other enquiries, we have experience with SMI’s BeGaze software and we are happy to talk metrics and methodologies so why not get in touch!
Keeping an Eye on Education June 7, 2017
Posted by Jon Ward in eye tracking, Technology, Tobii.add a comment
Eye tracking is widely used across many fields of academia and in the commercial world as a tool for research, training, behavioural analysis and gathering insight. However, until now equipping a lab with research quality equipment and market leading analytical software has been expensive, meaning that classrooms or lab set-ups are limited to one or two systems, and users often fight for time with the equipment to complete their projects, or miss out on the powerful data that can be gathered from eye tracking.
Acuity and Tobii have teamed up to create a unique solution offering powerful functionality, maximum flexibility and outstanding value for institutes wanting to offer eye tracking to their students. This enables departments such as psychology, marketing, economics, neuroscience and computing to equip multiple research workstations in a simple and cost effective manner.
The set-up allows students to run individual projects, work in groups or teams and of course to participate in a single project that can be analysed centrally as well as locally. This flexibility allows people to work at their own pace or be led by a teacher, and allows tailored studies to be run to accommodate users with specific requirements – such as colour blindness or dyslexia – without excluding them which could happen with a ‘group’ style single test that is pushed out to all users, as with some other solutions.
You can fully explore and understand human behaviour, information gathering, decision making, emotional processes and much more using high quality, research grade eye tracking systems without compromising on analysis capabilities! Every workstation has a full software suite allowing them to design, present, record, review and analyse the data, meaning everyone has access to the powerful analytical tools, not just a central licence or moderator.
Users can create static and animated visualisations of interactions and run statistical analysis. They can combine this with mouse movements, key presses, user camera video, flagged observations and audio recordings across a wide range of stimulus including websites, video, images, PDF’s, questionnaires and external video sources.
The solution is fully scalable from ten units to an unlimited number of workstations, and can be upgraded or expanded at any time, and all our solutions come with expert on-site training and support.
We can tailor a proposal to the size and scale of your requirements, and offer advice on infrastructure, lab configuration and integration with existing equipment. Contact us at sales@acuity-ets.com or on +44 1189 000795.
Neuro-Tools: Emotion Detection January 16, 2017
Posted by eyetrackrob in Biometric, Captiv, neuromarketing, Tips And Tricks, Uncategorized.Tags: biofeedback, biometrics, emotion detection, emotions, GSR, Heart Rate Variability, Heartrate, respiration rate, valence
1 comment so far
Much of the research that requires biofeedback involves emotions and the detection or classification of those. But as you surely noticed emotions are a very complex topic with many different aspects and challenges. Measuring when and how strong these events occur is relatively easy using electrodermal sensors, cardiovascular sensors or respiratory sensors and a software in which to process the raw data (and maybe even applies emotion detection algorithms – as TEA Captiv does). Things that I covered in my previous posts.
But immediately after knowing when and how strong an emotion occurred, the inevitable question comes up: “was it a positive or negative emotion?” (Valence) with the usual follow up question: “which emotion was it?” (Classification).
We have seen that each tool has its merits when it comes to finding emotions, but most biofeedback sensors on their own have the limitation that they can’t really give us answers regarding those rather interesting questions about valence or classification.
However countless studies exist, that cover specific emotions or sets of emotions and that use different sensors to measure the bodily reactions to those emotions. If we could just review all those studies, we could surely come up with a map showing which emotions could best be captured with which sensors and how the measurements might differ from one emotion to another so that we could identify specific emotions (i.e. fear, happiness, anger etc.) from those measurements.
 Identifying emotions just by looking at the different biometric measurements. Is it possible?
Sylvia D. Kreibig probably had the same idea and reviewed 134 publications that report research of emotional effects so that you don’t have to. Her review “Autonomic nervous system activity in emotion” was published in 2010 in Biological Psychology holds some interesting findings as well as food for thought.
Before getting to the eye opening results, there are a few take-aways from her research that might be interesting.
- Generally most research is done on negative emotions. And in general negative emotions have been associated with stronger autonomic reactions. However in her review she did not report on magnitude of changes partly for reasons described in #3).
- Heart rate was the most used measurement in those 134 studies, followed by GSR and much more than HRV or Respiration.
- Baselining! Do it! Some of the studies she reviewed did it, others didn’t. There are a number of ways to do a baseline: neutral or benchmarking/variable. While there is no definitive way to do it (making it more complicated to compare between studies), the important thing is that you use some kind of baseline to compare your results to.
- A rose is a rose is a rose. But in emotions the same term describing an emotion can mean different things. Disgust can be induced due to contamination (dirty toilets, fowl food) or due to injury (mutilations, blood). Sadness can provoke crying or not and there are many other ambiguities: although anger for example is always a negative emotion it can drive people either away (withdrawal/avoidance motivation) or pull them closer in an aggressive move (approach motivation). Emotions that are semantically close such as fear and anxiety or amusement and happiness might still be based on distinct behavioural systems!
- Artifacts may influence the measured response. Watch out for the effects of posture and movements, ambient temperature and cognitive demands! Start with sensors that give you good signal quality to start with. If you then use TEA Captiv you can process the data, apply artifact detection algorithms and filters to smoothen the data and eliminate unwanted effects.
There are a few more things that need to be considered when comparing data from different studies but these are my personal top 5 take-aways. Apart from the results of course.
In the table below you can see already my summary of her results. In her review, she reports that HR was increased in most emotions and surprise. However in her review she comes to the conclusion that the HR decreased in emotions that involve an element of passivity such as non-crying sadness, contentment, visual anticipatory pleasure and suspense.
GSR was increased in most emotions probably reflecting motor preparation and increased action tendency and of the more commonly induced emotions in (commercial) research just non-crying sadness lowers GSR. All other emotions tend to increase the reaction.
HRV has been shown in quite a few studies to be useful as an indicator for cognitive workload. Low HRV usually correlate with means high stress levels. Since her review was mainly focused on emotions, cognitive workload was not considered and the use of HRV was not too helpful.
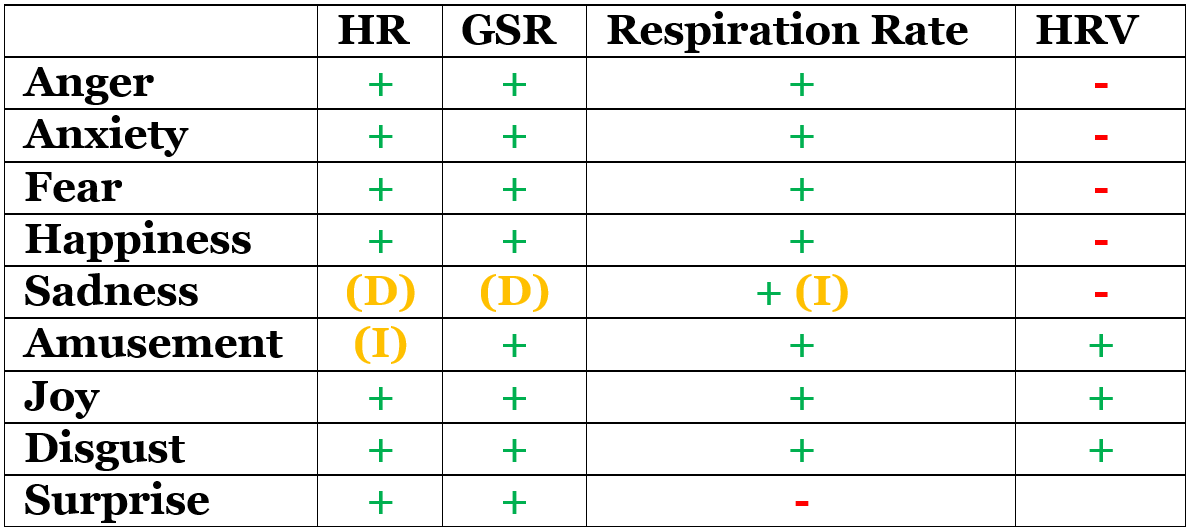
The table shows different emotions and how they influence measurements, which can increase (+), decrease (-), depend on different factors (D) or are indecisive (I)
So, what does this table tell us? Is there a specific fingerprint of biometric activities unique to each emotion?
Maybe!
Under very controlled conditions and also taking into account other types of measurements there might be potential to discover a unique signature to some emotions.
Unfortunately for many researchers, very distinct emotions such as Anger and Happiness or Joy and Disgust have very similar bodily reactions – if we look only at HR, GSR and Respiration Rate. Different types of sadness can cause a variety of reactions, making it actually a very interesting research subject in my opinion, but this doesn’t make it easier for your everyday research and especially when it comes to commercial research you might not be able to control for every possible factor and to use too many sensors.
My personal conclusion is that while tools such as GSR, HR, Respiration or Heart Rate Variability can help us detect emotions, in most research projects they don’t allow to uncover which emotion it is and not even if it is a positive or negative emotion.
But on the positive side, we still have a few other tools in our Neuro-Toolbox that can help us along the way: Facial Expression Analysis for example, Implicit Association Tests or even EEG can help us to understand emotions, associations and motivations and thus help us to detect valence or even to classify emotions.
With this in mind, I’ll be covering Facial Expression Analysis in my next post as it is probably the easiest to use out of the three.
If you want to dig deeper into the original report, you can find it here: http://www.sciencedirect.com/science/article/pii/S0301051110000827
Sylvia D. Kreibig has since then been involved in some interesting research projects following up on the results. Take a look at her work on Research Gate.
Neuro-Tools : Heart Rate & Respiration November 21, 2016
Posted by eyetrackrob in Biometric, Captiv, eye tracking, Market Research, Marketing, neuromarketing, TEA, Technology, Uncategorized.1 comment so far
Although not as fast as I thought, step by step, I’ll be covering the most relevant biofeedback sensors in this blog series. So far I’ve only managed to write about GSR, one of the sensors of the hour! Galvanic Skin Response has been around for a long time and in the past years it has gained lots of attention from researchers, but as you might have read in my last post, although it deserves all the attention it gets, it’s not always that simple to use.
Other measurements mentioned before that could tell you more about emotions or cognitive workload are respiration, heart rate and from this also the possibility to calculate the variability of the heart rate (HRV).
Heart Rate
Heart Rate (HR) reflects the frequency of a complete heartbeat within a specific time window. It is typically expressed as beats per minute (bpm). The HR is constantly, antagonistically influenced by the sympathetic nervous system (SNS) and parasympathetic nervous system (PsNS) and in general heart rate, similar to GSR, unfolds rather slowly. Although with peak effects observed after 4 seconds and return to baseline after about 20 seconds it is much slower than GSR. Heart Rate Variability (HRV) on the other hand expresses the quick variations of the frequency between heart beats. The time between beats is measured in milliseconds (ms) and is called an “R-R interval” or “inter-beat interval (IBI).”

Image 1: shows a typical heart rhythm as recorded by an electrocardiogram (ECG). You can see heart rate (4bpm) as well as the differences in the inter-beat intervals.
Both measurements (HR and HRV) are closely related to emotional arousal, with HRV allowing for assessment of more sensitive and quicker changes, which also can be related to stress and cognitive workload (this might be a good topic for a follow up post).
While today many fitness devices exist that measure heart rate in the context of fitness and well being, those solutions might not be the ideal for your research. One of the reasons for this is the processing and averaging of data going on in the sensor.


Image 2: shows the same recording as averaged data export (blue) and as it was displayed during the recording (orange). The data was recorded with a wrist worn device measuring the HR optically using light. In the averaged data the highest heart rate is at around 100 bpm. In the live stream the same time frame shows much more variability (still averaging at around 100 bpm) and it’s clearly visible that it is not the highest value of the recording.
As mentioned above, heart rate has a relatively low sensitivity and slow response. Many wearable fitness trackers don’t allow to export the data for further analysis or allow to access only averaged data, where quick spikes in the data have been eliminated as noise. The result of this prepossessing of data is that the effects of emotion might be lost altogether. On the other hand to compute HRV correctly, continuous and precise measurements must be guaranteed. Just 2-3 missed data points can mean inaccurate calculations of the times between beats and thus again missing relevant events.

Image 3: In the live visualization the highest heart rate reaches 145bpm. However the suspiciously round form reaching to the peak value indicates that data points are missing and data was interpolated. This becomes clear when looking at the averaged data. This data would not be suited for interpretation of HR or HRV.
Another reason why many heart rate trackers available for fitness purposes are not necessarily a suitable solution for researchers is that most of them are worn on the wrist and use light to measure blood flow and from there derive the heart rate. Compared to sensors that are placed close to the heart and measure electrical impulses (electrocardiogram/ECG), sensors on the wrist have to overcome challenges of compensating for movements, muscle-tensing, sweating and potentially light interference. ECG sensors are therefore the recommended tool for data collection for research purposes as they are more sensitive to certain signal characteristics.


Image 4: ECG Sensor as belt or as electrodes
Respiration
Research has associated respiration rate and depth with emotional impact and emotional valence. Interestingly olfactory information ascends directly to limbic areas and is not relayed through the thalamus as other sensory input. The Thalamus is a part of the brain which is acting as a relay and pre-processing for sensory information and is accounted to be relevant to regulate consciousness, arousal, wakefulness and alertness. As olfactory information is not relayed through this part of the brain, there is a different mechanism to make olfactory information conscious which leads to quicker physiological response and unconscious alternation of the respiratory pattern. Respiration patterns therefore allow to identify potentially unconscious liking or disliking and arousal. The deduction of a unique emotion from respiration rate and depth does not seem to be possible although more research is still needed in this area.
Respiration measurements can be obtained either from the use of dedicated clinical instruments, stretch sensitive respiration belts or can be calculated from ECG data. The latter being the least invasive for commercial research.

Figure 6. Stretch Sensitive Respiration Belt
ECG data can be processed in TEA Captiv to obtain HR, HRV and even respiration rate and as with GSR all of the mentioned measurements can be synchronized with eyetracking to understand what visual information influenced a rise in HR, a change in HRV or an alteration of respiration patterns.
In my next post I’ll take a look at how all these measurements can be combined and if through a combination it is possible to not only detect emotional events but also understand whether it is a positive or negative emotion and even which specific emotion it is. So, watch this space for more!
Copy Cat Brands – Who is Trying to Steal Your Attention? October 31, 2016
Posted by Jon Ward in Advertising, eye tracking, Market Research, Marketing, neuromarketing, Shopper Research.add a comment
Tim from Acuity has recently been speaking at a conference in Peru where he presented some of the exciting findings from our parasitic brands research last year. Using the world leading facilities at the GSK SSL and in partnership with the British Brands Group we tested people’s recognition of famous brands and their not-so-famous imposters under a variety of conditions. Have a watch of the video below and maybe head over to the Acuity Intelligence website and read more about the study here : http://www.acuity-intelligence.com/blog/statute-of-imitations
Tobii Eyetracking & Garmin GPS/ANT+ Data for Sports and Real-World Wayfinding Research October 31, 2016
Posted by Scott Hodgins in Biometric, eye tracking, Glasses, Tips And Tricks, Tobii, Uncategorized.add a comment
In Jon’s previous blog post he mentioned me running and training with some friends over at Forest Fit Clubs and added a video link. I wanted to reply to the inevitable questions about data overlays etc. and how did we do this with the Tobii software? The short answer is that we didn’t, here’s a “how to” to get you started.
This version is based on a running, other examples include:
- Wayfinding – overlay GPS data on the eyetracking video so you can immediately see where pedestrians moved in the built environment. Understanding how people use signage, do they see it? do they understand and use it?
- Driving & Flying – use the GPS and speed/G-Metrix data to understand the technique and relationships between looking-engaging and acting on that information.
- Data overlay’s are not just limited to the Garmin descriptions – you can hack the overlays to change the title and add maybe GSR data, or cognitive data and arousal metrics from an EEG such as the ABM X-10
Overview.
We wanted to show the power of adding basic data overlays onto the eyetracking video so we could easily associate an action from the video with a resultant change in data. We had a Garmin VIRB XE that we had used for a technical demonstration with a customer. I had noticed that the VIRB produced MP4 files, as did the Tobii Glasses 2 (TG2), so the idea of hacking the workflow, swapping the VIRB video out and overlaying biometric and location data over the TG2 video data was born. Below is a video showing an overview of the software.
The kit list:
1 x Tobii Glasses 2 (any variant)
1 x Garmin Fenix 2 Sports watch (now replaced by the Fenix 3 and Fenix 3 HR, which may be an alternative source for HRM data)
1 x Garmin HRM RUN Heart rate monitor, we wanted this as it also offered specific run data, not just HR
1 x Garmin VIRB XE & Garmin VIRB Edit Software (we didn’t use the camera, just the software)
1 x Willing participant (me, and yes I calibrated myself, in daylight, outside, it is super-easy with the TG2) with a suitable pocket or running belt to stash the recording unit in.
The steps:
- Assemble the TG2:
Connect Head Unit-Cable-Recording Unit, Insert SD Card, Insert Battery & power up. This took about 5 minutes instead of the normal 2 minutes as I threaded the cable under my base layer to control the cable movement and placed the recording unit in a neoprene running belt to control movement. (1) - Power up the controlling computer, we use Dell Venue 11 Pro’s (Now Dell Latitude 11 5000) running W7 Pro or W10 Pro x64.
- Connect to the TG2 WLAN, start Tobii Glasses Controller, select “New Recording”, add a participant name and description.
- Calibrate: Select the icon in the bottom right of the screen to calibrate (easy on the tablet – just touch) and look at the calibration marker – for non Tobii users a fully 3D calibration is completed typically <5s. A major advantage of this ground-breaking 3D calibration model is that we don’t have to try and “work around the data” during analysis. (2)
- Start the recording, then start the recording on the Garmin Fenix while looking at the screen – it’s not perfect but we should be able to sync the data to the frame where the recording started and at 25fps video we are sure that we are sync’d to about 40ms. (3) Turn the laptop off, or put it in sleep mode.
- Run around, enjoy the beautiful scenery at Somerley.
- Finish session, cool down, stretch – up to 90 minutes per battery so we have plenty of time head back to the car and stop the recording on both the Garmin Fenix and the TG2
- Stopping the recording, then select the recording and start to output the 1080p HD video.
- Sync Garmin to the cloud – in this case it was Bluetooth to Garmin Connect on my iPhone then auto sync’d to the cloud (connect.garmin.com)
- Login to your connect account, select the activity and download the FIT or GPX data from this session.
- Open VIRB Edit, create a new video and import the video you exported from the Tobii Glasses Controller, then add this to the video timeline.
- Import the FIT or GPX data, click on G-Metrix and then on Data and find your file.
- Sync the two files using one of the options at the foot of the G-Metrix>Data dialogue.
- Now use either the Templates and Gauges options to add data overlays on to the video, you can use appearance to change the colour of the gauges.
- Importing the logo & setting up a new template is more art than science – good luck with that, I think it took me about a dozen failed attempts then it magically worked, I took the time to try again while writing this, it now shows as a Beta function in the software.
- Export the video to your chosen resolution and quality.
The next post will look at doing something similar, using TEA Captiv as a more scientific option, with multiple video feeds and more data options.
The end result:
Notes:
- It is worth taking 5 minutes here to make sure you have free movement before starting, otherwise turning too sharply could lead to disconnection or discomfort. Because I used the wireless version, once I was wired up and adjusted I didn’t need to touch the system again until I was retrieving data.
- Other wearable/head mounted eyetrackers have issues when we start looking in different planes. Their calibration model is typically a one dimension transform that is adequate when looking in the calibrated plane, the calibration will suffer when looking in a different plane. For example if we calibrate on a vertical wall (looking at the corners of a picture) then place that picture flat on the desktop we will see trapezoidal offsets, this is also true if we calibrate in a horizontal plane (desk) and look at a vertical target (wall). The result is that if we are not cognoscente of this and take the distorted (erroneous) data at face value we risk producing worthless results.
- There is a sync port on the Tobii that can send/receive an LVTTL pulse to/from an external device, however the Garmin watch isn’t designed for this so we chose to keep it simple with a video based sync.
- Garmin data formats, I have always used the GPX download to import into VIRB Edit, the FIT data caused a few anomalies specifically with time and GPS origin. The FIT file has all of the data recorded in Garmin Connect, the GPX has less, there was still enough for this example though.
